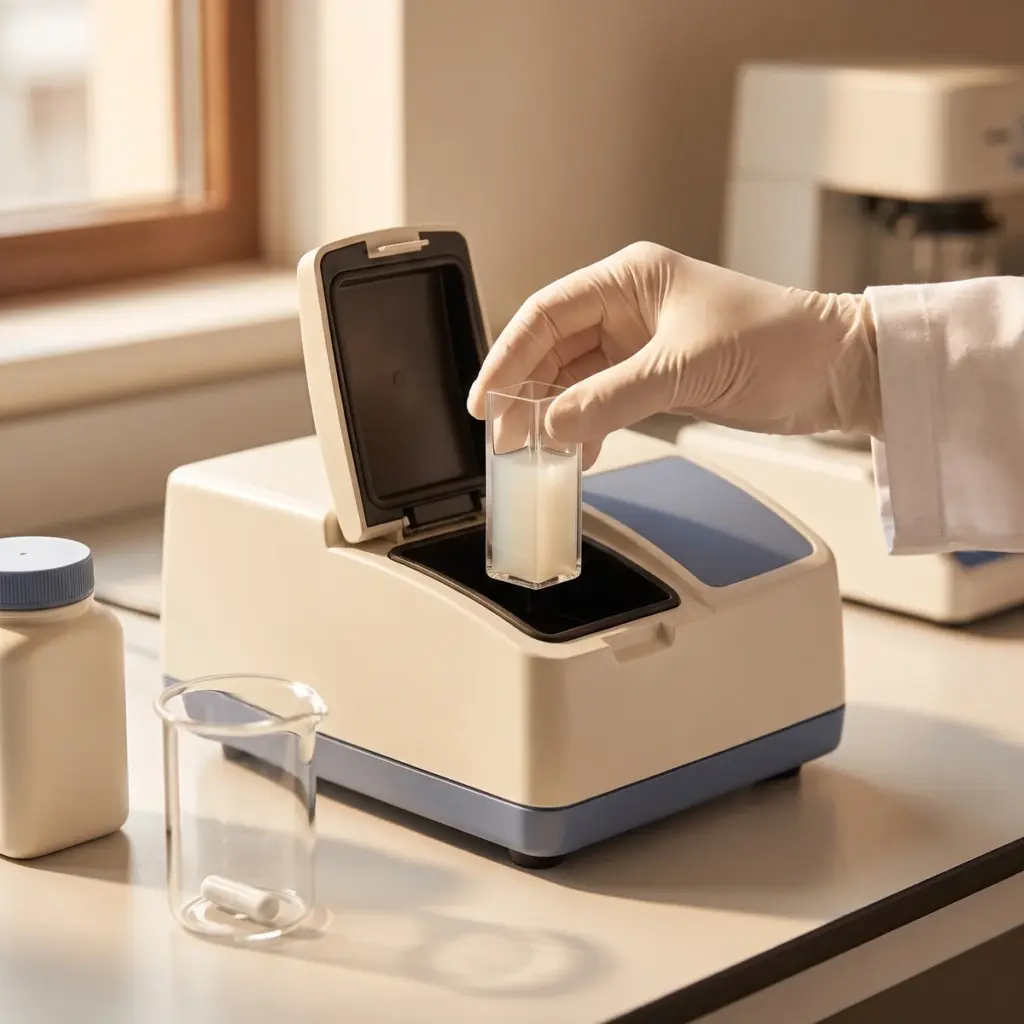
Particle size distribution overview
Do you provide Particle size distribution?
Particle size distribution methods and results
A single average size hides the detail that matters in a cosmetic material. A pigment with a few coarse agglomerates streaks, a scrub with a fine tail feels different, and an emulsion whose droplets are coarsening is on its way to separating. The distribution shows all of this.
Laser diffraction, DLS and image analysis
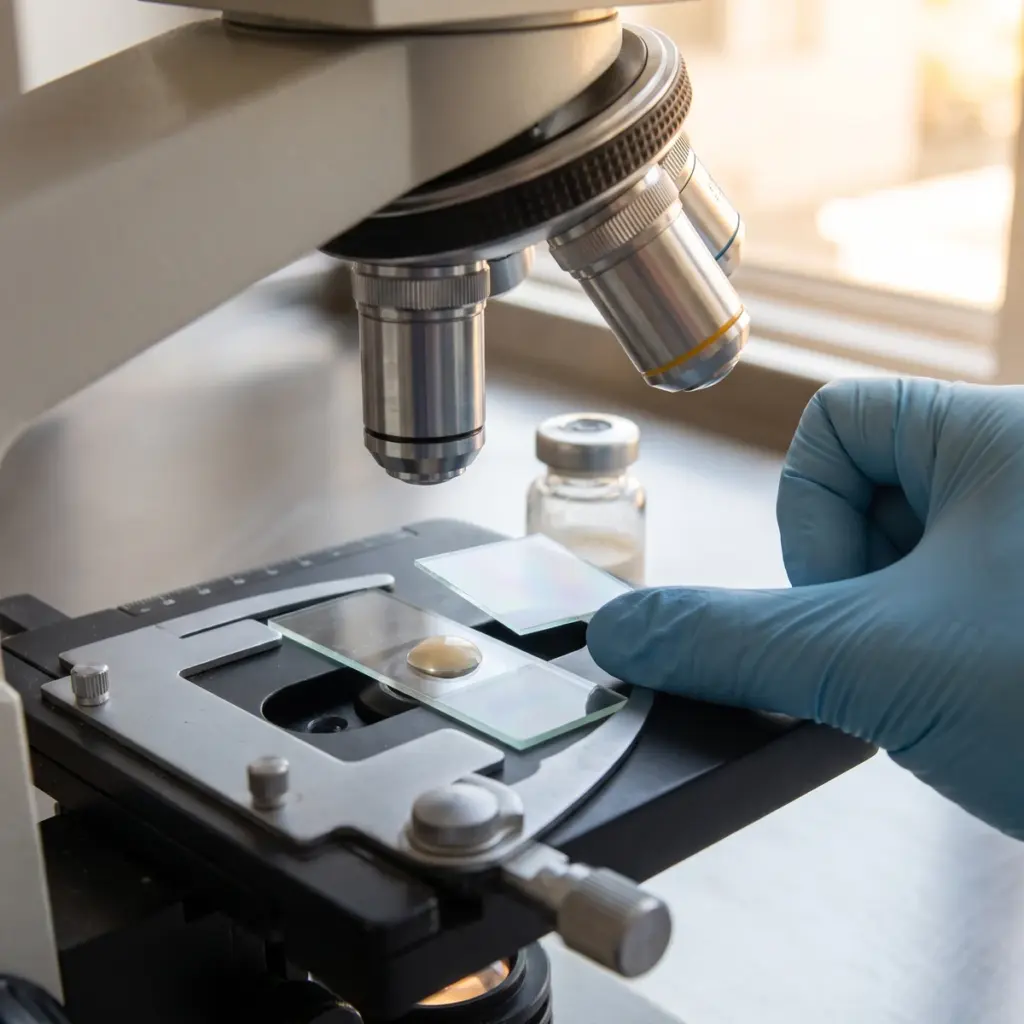
Laser diffraction covers a wide range, from below a micrometre up to millimetre-sized particles, and suits powders, pigments, scrubs and most emulsions. It reports a volume-weighted distribution. Dynamic light scattering measures particles in the nanometre range, such as fine dispersions and nanoemulsions, and reports an intensity-weighted size with a polydispersity index. Image analysis counts individual particles under a microscope, gives a number-weighted result and adds shape information. Because the weighting differs, the laboratory states which basis each figure uses.
Sample preparation
Powders are measured dry or dispersed in a liquid with a suitable wetting agent, and emulsions are diluted in their continuous phase. Ultrasound may be used to break up loose agglomerates when primary particle size is the target, and left out when the agglomerate state is what you want to see. The laboratory records each choice in the method so later batches are prepared the same way.
What the report shows
- Distribution curve with the measurement basis stated
- D10, D50 and D90 values and span
- Polydispersity index for DLS measurements
- Evidence of more than one population
- Overlay against a reference batch or earlier time point
How brands use particle and droplet size data
Size results earn their keep at goods-in, during stability storage and in nanomaterial documentation.
Qualifying pigments and powders from a new supplier
Two lots of the same pigment grade can differ in agglomeration, which changes colour strength and pay-off. Comparing the incoming distribution with an approved lot before release to production catches the difference early. For pressed powders, a coarse fraction also explains complaints of grittiness or poor compaction.
Following emulsion droplets through stability
Droplet growth during storage is one of the first signs of coalescence. Measuring at each stability time point, in the same diluent and conditions, gives a trend you can act on, and analytical microscopy shows whether a larger population is merged droplets, crystals or trapped air.
Picking a laboratory for nanoscale work
For mineral UV filters and other materials that may fall in the nanoscale, ask whether the laboratory runs both DLS and electron microscopy, and whether it can measure the material as supplied and dispersed in the finished formula. Experience with dispersing hydrophobic coated powders matters here, because poor dispersion inflates the measured size.
More in Physicochemical Testing
Physicochemical testing measures a cosmetic’s active content, pH, viscosity, particle size and structure to set specifications and explain changes.