NAD+/NADH balance overview
Do you provide NAD+/NADH balance?
How NAD+/NADH balance is quantified in skin cells
NAD+ accepts electrons in glycolysis and the citric acid cycle and becomes NADH, which delivers them to complex I of the mitochondrial respiratory chain. NAD+ is also consumed by sirtuins and PARP enzymes, so cells keep rebuilding the pool through salvage pathways that start from nicotinamide. The total amount and the NAD+/NADH ratio together describe both supply and redox state.
Extraction and enzymatic cycling
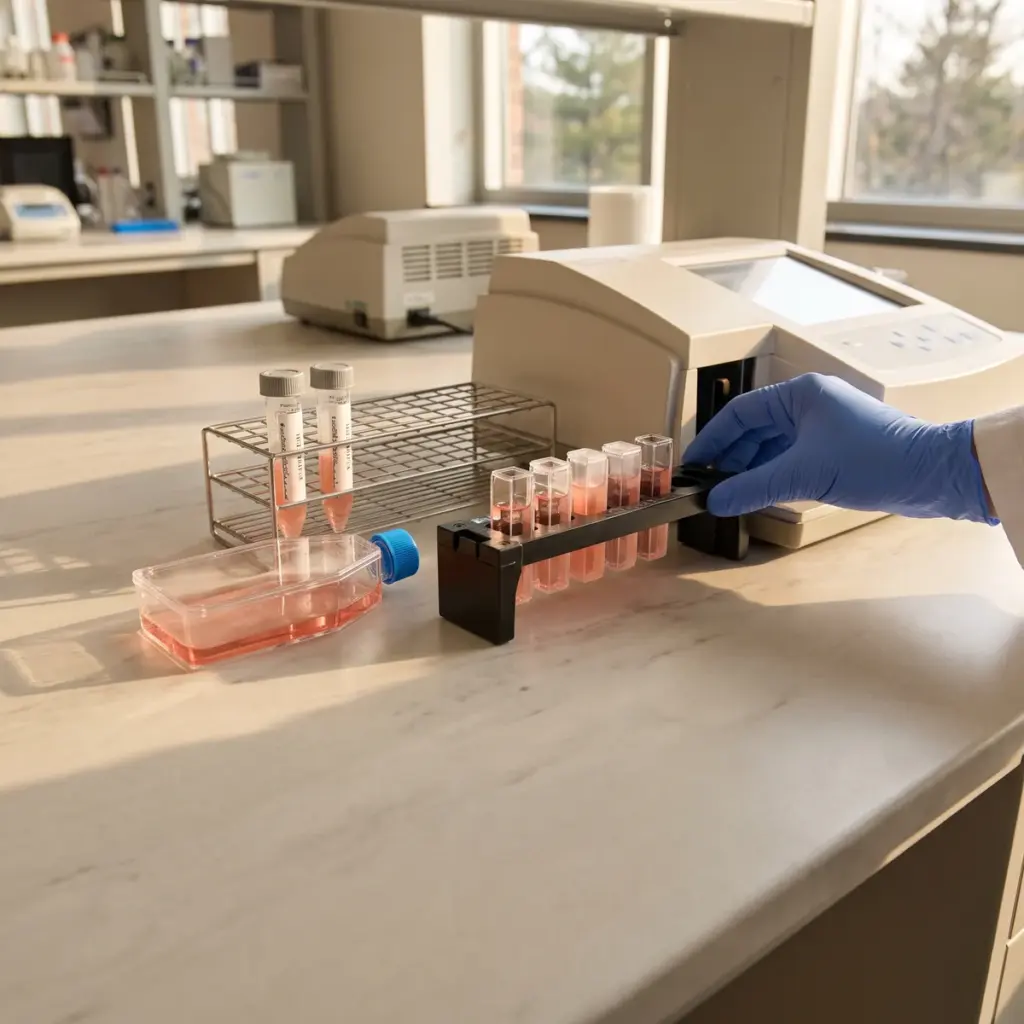
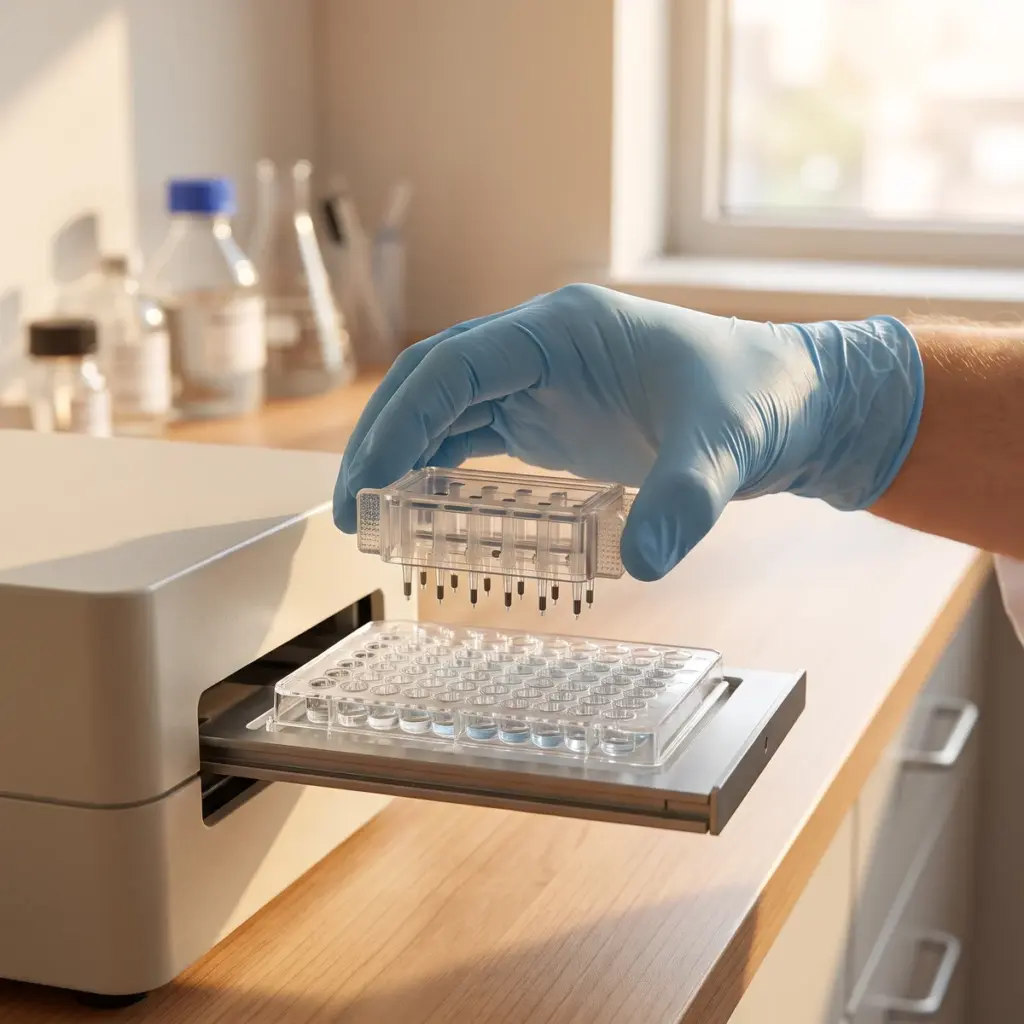
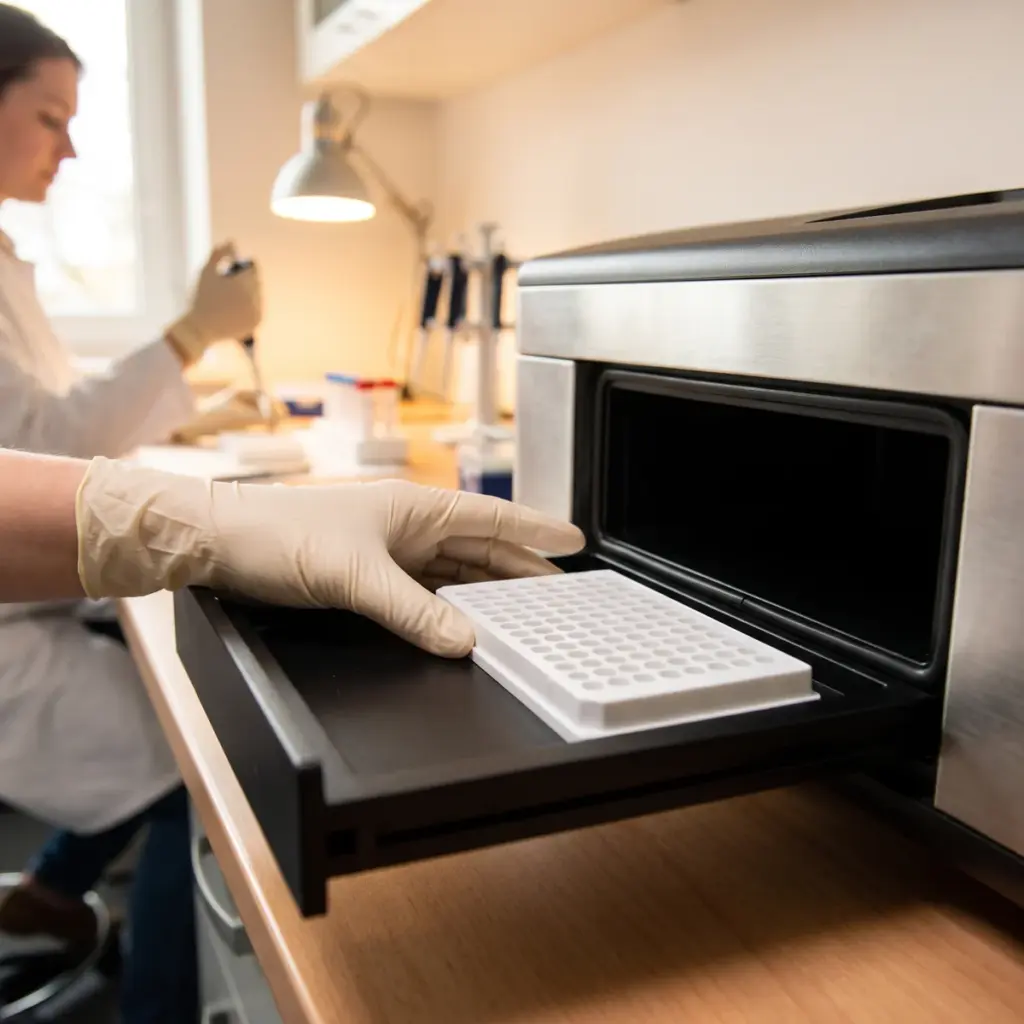
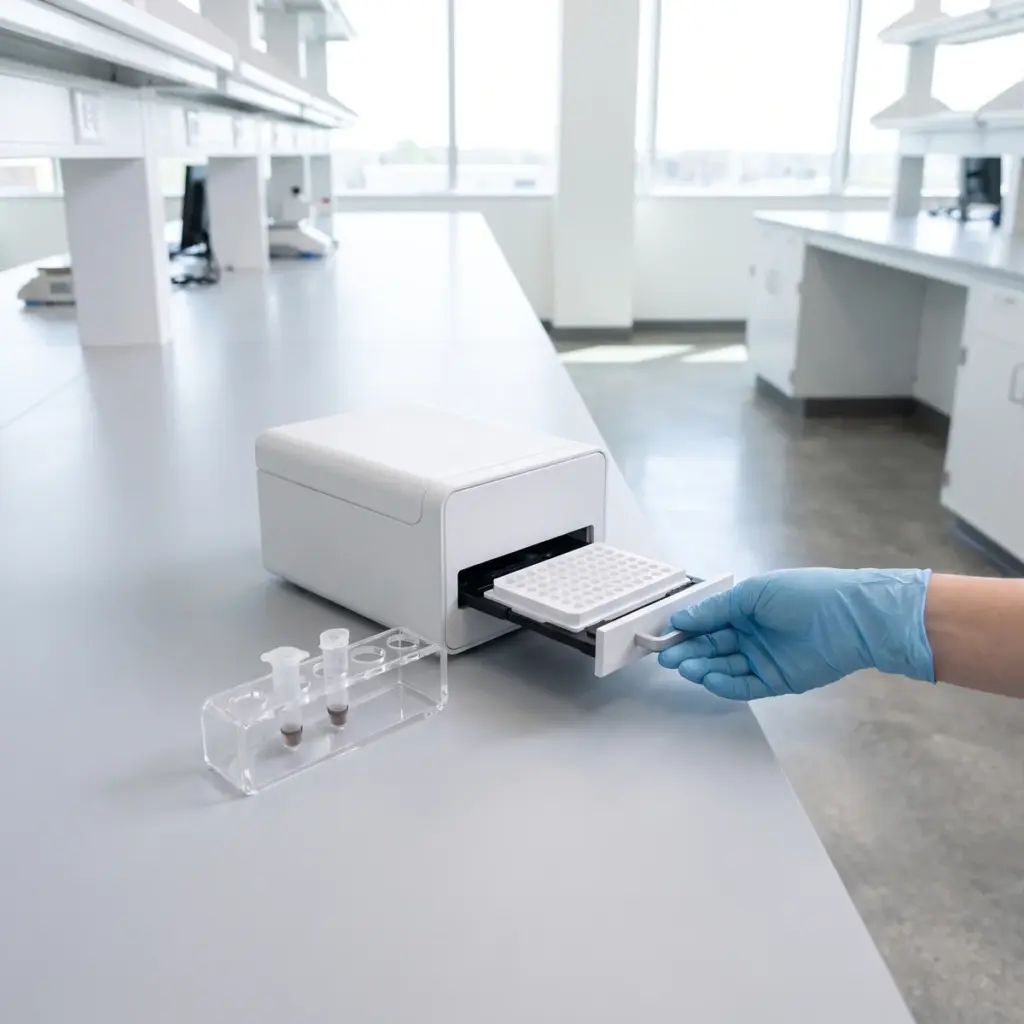
After exposure, cells are lysed in two parallel extractions. An acid extraction destroys NADH and keeps NAD+, and an alkaline extraction does the reverse. Each extract goes into an enzymatic cycling assay, in which the coenzyme drives repeated turnover of a detection substrate and the colorimetric, fluorescent or luminescent signal grows in proportion to its concentration. LC-MS gives direct quantification when a study also needs related metabolites such as NADP+ or nicotinamide mononucleotide.
- NAD+ concentration
- NADH concentration
- Total NAD and the NAD+/NADH ratio
- Concentration-response and time-course data
Controls and normalisation
Untreated and vehicle controls run alongside the test material, and a known precursor such as nicotinamide mononucleotide is a common positive control. Results are normalised to protein content or cell number. A spiked sample confirms that the cycling reaction reads correctly in the presence of the test material.
NAD+ and NADH values with calculated ratio
The report lists each analyte per sample, the calculated ratio, statistics against controls and the extraction and detection methods used.
Building an NAD-boosting claim on NAD+/NADH balance data
NAD+ levels in skin fall with age, which makes the coenzyme a popular target for anti-ageing actives. A measured rise in the NAD+ pool is the evidence buyers ask for first.
NAD+ level claims and precursor benchmarking
The study gives direct evidence for ingredient statements such as ‘increases NAD+ levels in skin cells’. Precursor suppliers use it to compare their ingredient with nicotinamide or another benchmark at equal concentrations. Brands place the report in the claim support file for a finished product built around that ingredient.
Fitting NAD data into a metabolic panel
Because NADH feeds the respiratory chain, NAD+/NADH data pairs well with oxygen consumption profiling and mitochondrial function testing. A larger NAD+ pool followed by higher ATP-linked respiration in the same model gives coherent energy evidence, from coenzyme supply to mitochondrial output.
Questions to ask a laboratory
Ask whether NAD+ and NADH are extracted separately or read from one lysate, since separate acid and alkaline extraction gives cleaner values for each form. Check how quickly samples are processed and frozen, because NADH degrades once cells are lysed. If you want a precursor comparison or NADP+ data, ask whether the provider runs LC-MS in-house.
More in Skin-Cell Energy & Metabolism Studies
Skin-Cell Energy & Metabolism Studies measure ATP, oxygen consumption, glucose use and NAD+ balance in skin cells to profile energising cosmetic actives.